As CSU no longer has access to Journal Citation Reports (JCR), we’ve received many queries about how to find information on the relative quality of journals. To help you guys out, we’ve put together a bit of a run-through of how to go about it!
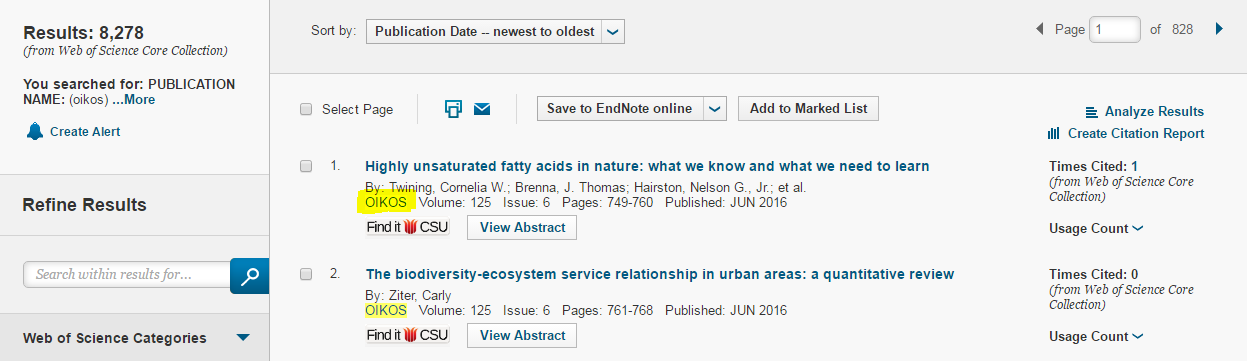
In WoS, change the search criteria from ‘Topic’ to ‘Publication Name’ (you can also search for a particular article if you prefer):

Within the results from that journal click on the hyperlinked journal title:
To begin with, locate SJR here (or you can do a Google search for ‘SJR’): http://www.scimagojr.com/
In SJR conduct a search for your journal using the search tool, making sure that you are in the journal ranking tool and not the country ranking tool:

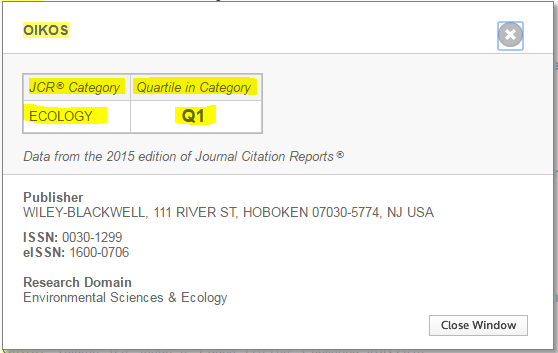
On the next page, SJR provides you with a number of metrics for your journal, including an H-index (the number of articles n, that have that number of citations, n), and a quartile chart for each category that the journal is in based on its SJR score:
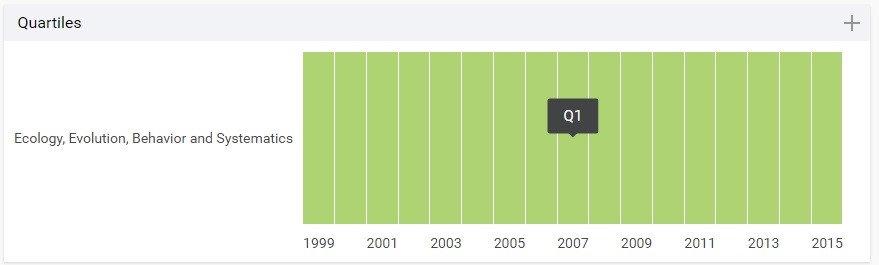
In this case the journal only appears in one category and has been in the top quartile each year, therefore the chart only has one set of boxes and they are all green (green=top quartile, yellow=second quartile, orange=third quartile, red=last quartile).
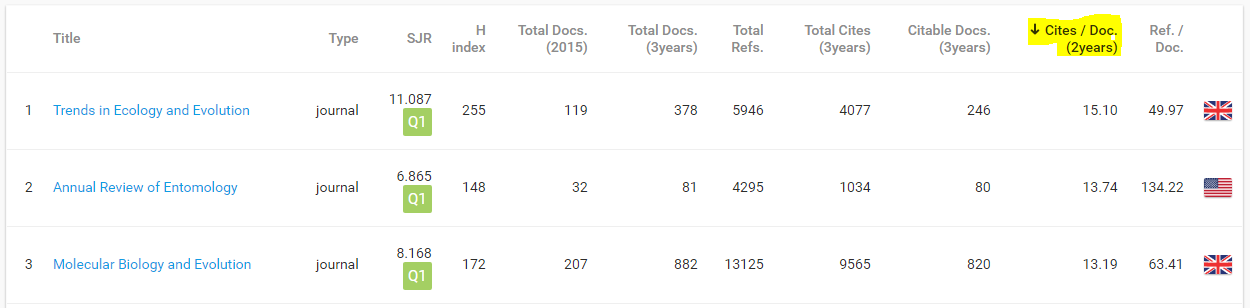
You can also get further information from many of the other charts and statistics listed below the quartile results. In addition, you can get more information on a particular category by clicking on any of the hyperlinks to that category:
The category data lists the top journals in the category by whichever column you select at the top of the data (the default is SJR score).
Discover more from Charles Sturt University Library Blog
Subscribe to get the latest posts sent to your email.